Bollinger Band Squeeze with Dotted MidlinesBollinger Band Squeeze with Dotted Midlines
Overview:
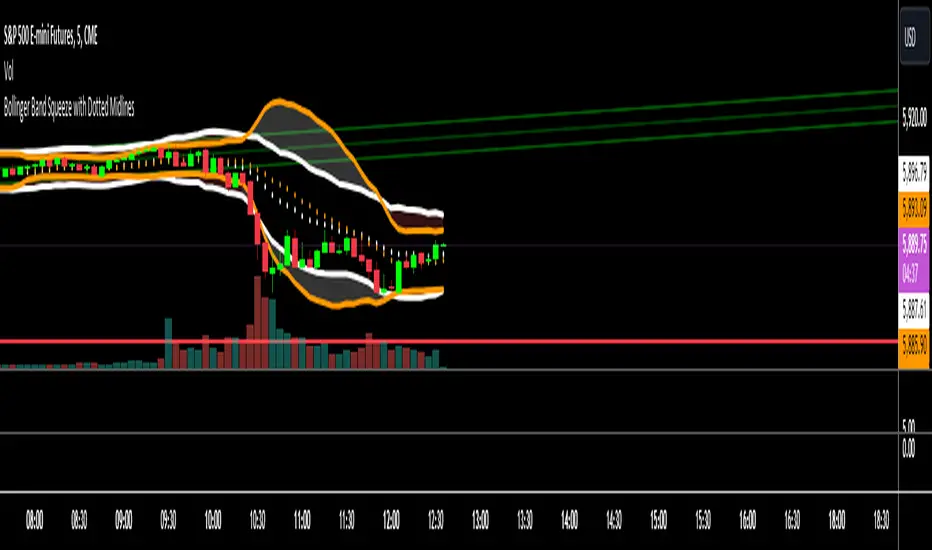
The Bollinger Band Squeeze with Dotted Midlines indicator is a powerful tool designed to identify periods of low volatility in the market, known as "squeeze" conditions, which often precede significant price movements. By combining Bollinger Bands and Keltner Channels, this indicator highlights when the market is consolidating and prepares traders for potential breakouts.
Key Features:
• Squeeze Detection: The indicator fills the area between the Bollinger Bands and Keltner Channels with a semi-transparent red color when both the upper and lower Bollinger Bands are within the Keltner Channels. This visual cue signifies a squeeze condition.
• Dynamic Color Filling: When the Bollinger Bands move outside the Keltner Channels, the fill color changes to a semi-transparent white, indicating the end of the squeeze and the potential start of increased volatility.
• Enhanced Visual Clarity:
o Upper and Lower Bands: The upper and lower lines of both the Bollinger Bands and Keltner Channels are plotted with increased thickness (3pt) for better visibility.
o Midlines with Dotted Effect: The middle lines (50% lines) for both the Bollinger Bands and Keltner Channels are plotted as dotted lines using circles with a thinner line width (1pt), providing a clear yet unobtrusive reference point.
Indicator Components:
1. Bollinger Bands (Orange Lines):
o Upper Bollinger Band: Calculated as the moving average plus a multiple of the standard deviation.
o Lower Bollinger Band: Calculated as the moving average minus a multiple of the standard deviation.
o Middle Bollinger Band: The simple moving average (SMA) of the closing price.
2. Keltner Channels (White Lines):
o Upper Keltner Channel: Calculated as the exponential moving average (EMA) plus a multiple of the average true range (ATR).
o Lower Keltner Channel: Calculated as the EMA minus a multiple of the ATR.
o Middle Keltner Channel: The EMA of the closing price.
3. Squeeze Condition Fill:
o Red Fill (40% Opacity): Indicates a squeeze condition where the Bollinger Bands are entirely within the Keltner Channels.
o White Fill (40% Opacity): Indicates normal market conditions where the Bollinger Bands have moved outside the Keltner Channels.
How to Use:
1. Identifying Squeeze Conditions:
o Look for Red Filled Areas: When you see the area between the Bollinger Bands and Keltner Channels filled in semi-transparent red, it signals a squeeze condition. This means the market is experiencing low volatility and may be preparing for a significant move.
2. Preparing for Potential Breakouts:
o Monitor for Fill Color Changes: A transition from red to white fill suggests that the squeeze is ending, and volatility is increasing. Traders often interpret this as a potential opportunity for a breakout in either direction.
3. Utilizing Midlines:
o Reference Midlines for Trend Direction: The dotted midlines provide insight into the overall trend. Crossing of the price above or below these lines can offer additional confirmation for trading decisions.
Customization Options:
• Bollinger Bands Settings:
o Length: Default is 20 periods. Adjust to change the sensitivity of the bands.
o Multiplier: Default is 2.0. Modify to increase or decrease the band width based on standard deviation.
• Keltner Channels Settings:
o Length: Default is 20 periods. Alter to adjust the responsiveness of the channels.
o Multiplier: Default is 1.5. Change to widen or narrow the channels based on average true range.
Advantages:
• Visual Clarity: Enhanced line thickness and semi-transparent fills make it easy to spot key market conditions at a glance.
• Early Warning System: By identifying squeeze conditions, traders can anticipate potential breakouts and plan their strategies accordingly.
• Flexible Application: Suitable for various timeframes and trading styles, including day trading, swing trading, and position trading.
Limitations:
• False Signals: Like all technical indicators, it may produce false signals, especially in choppy or range-bound markets.
• Should Be Used with Other Indicators: For better accuracy, it's recommended to use this indicator in conjunction with other technical analysis tools and not as a standalone signal generator.
Conclusion:
The Bollinger Band Squeeze with Dotted Midlines indicator is a valuable addition to any trader's toolkit. By effectively highlighting periods of consolidation and potential breakout points, it aids in making informed trading decisions. The visual enhancements improve usability, allowing traders to quickly interpret market conditions and respond appropriately.
Chỉ báo Pine Script®